


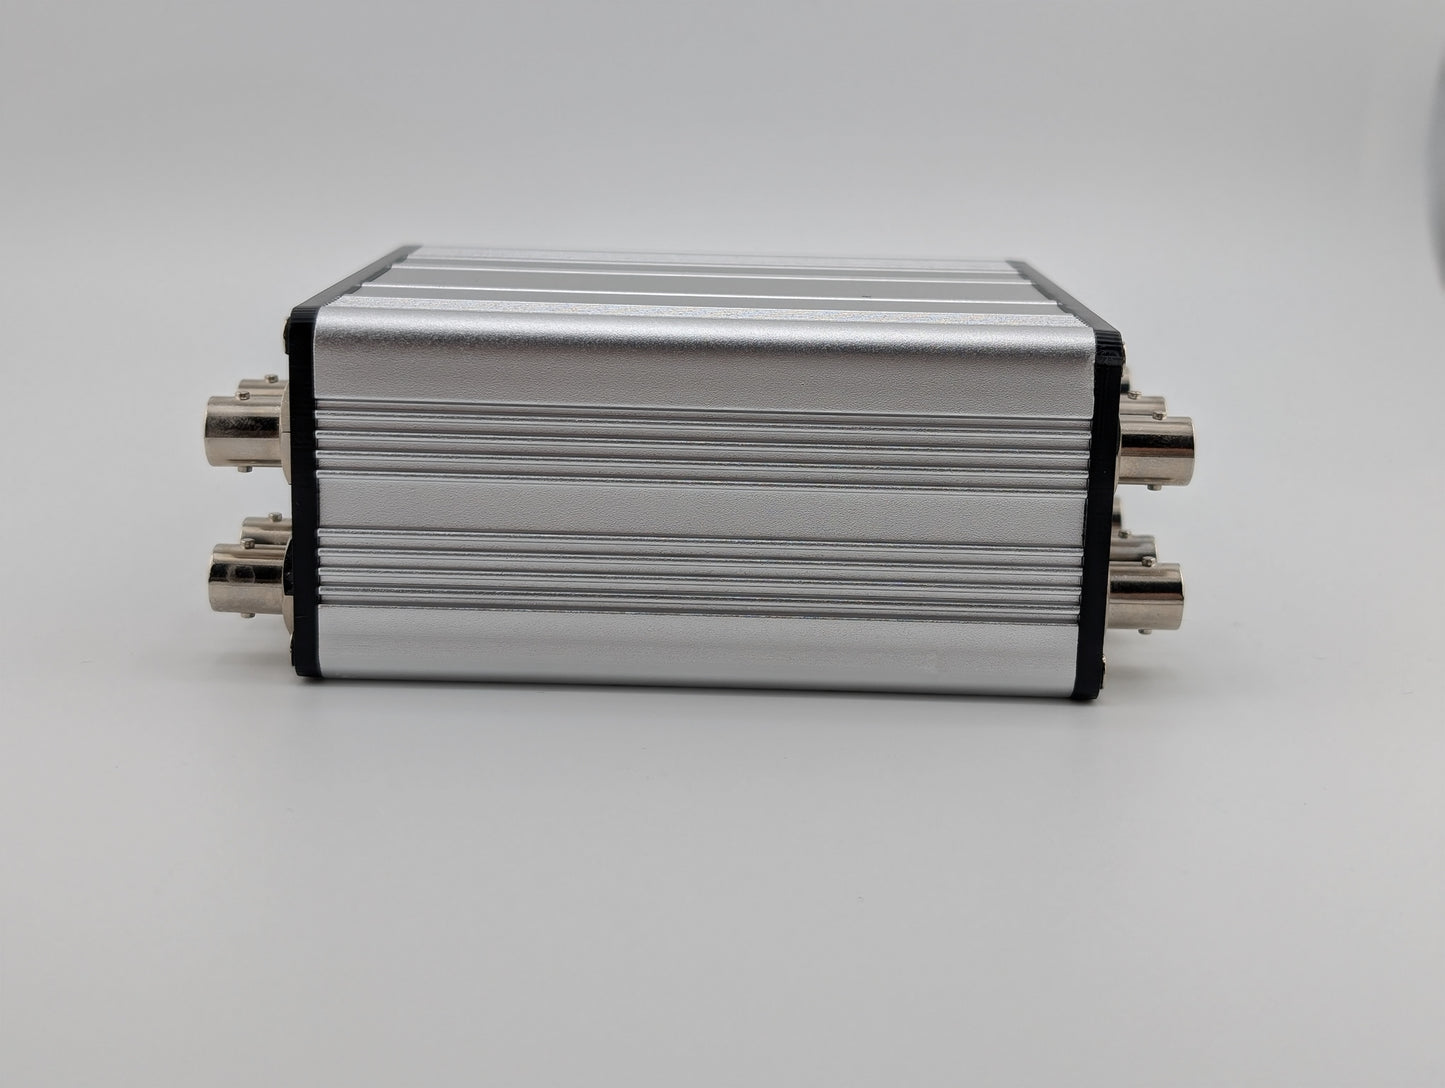
Why you need it
Many pieces of lab equipment output electrical signals that need to be recorded. Some take electrical signals as input to control their behavior. The picoDAQ can simultaneously record four channels of analog and digital data each, at up to 75 kHz. It can also simultaneously output four channels of analog and digital data. The picoDAQ can be controlled from a graphical user interface or from Python on all major operating systems: Windows, Mac, and Linux.
Graphical user interface
The picoDAQ comes with a full-featured GUI for immediate visualization, configuration, and recording. EScope is free and open source and can be installed on any operating system:
pip install escope
escope
Python interface
PicoDAQ comes with the easiest-to-use API in the industry. The extensively documented Python “picodaq” library is free and open source and allows access to all the features of the hardware. After
pip install picodaqyou can acquire and display data with just a few lines of python code:
from picodaq import *
import matplotlib.pyplot as plt
with AnalogIn(channels=[0, 1], rate=50*kHz) as ai:
    data, times = ai.read(10*s, times=True)

plt.plot(times, data)
plt.xlabel("Time (s)")
plt.ylabel("Voltage (V)")
Potential use cases
- Record four analog signals (e.g., output from electrophysiology amplifers, microphones, photodiodes, other sensors);
- Drive four analog outputs (e.g., galvos, speakers, LEDs, stimulation hardware) with precise timing alignment to acquisition;
- Monitor four digital lines for frame clocks, behavioral events, etc.;
- Control four digital lines for triggering various pieces of equipment;
- Do it all at 75 kilosamples per second per channel, concurrently.
Deterministic acquisition and output, with a GUI when you want to see what’s happening, and Python when you want to control everything yourself. It just works.
- Choosing a selection results in a full page refresh.
- Opens in a new window.